
● Overview
● Sys Arch
● Vent Ctrlr
● Fan Ctrlr
● Eq Int Module
● Env Manager
►Results
● Future Plans
● Survey
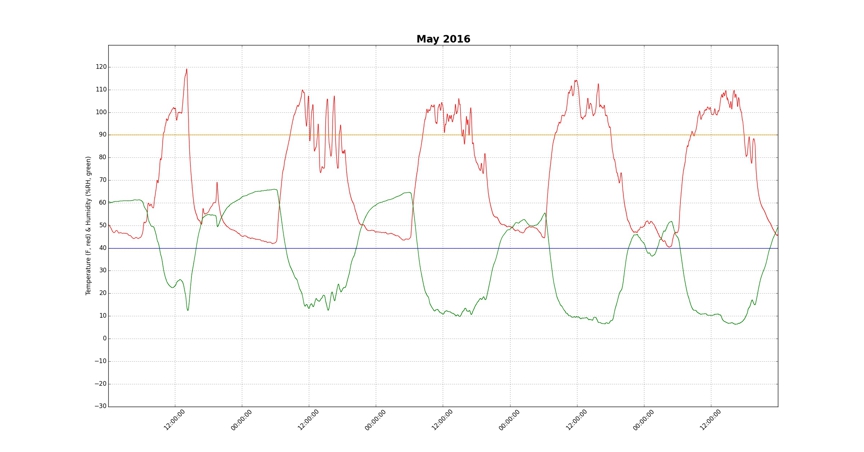
Greenhouse Automation - Results In the following charts the temperature of the greenhouse in °F is shown in red and the relative humidity of the greenhouse is shown in green. The x-axis is time and the y-axis is temperature / relative humidity reading. The first chart (below) shows the temperature variations in the greenhouse over a period of five days in May 2016, before the greenhouse environment automation components were installed. In spite of the mild ambient temperatures in May, greenhouse temperatures rose as high as 120° and varied as much as 37°.
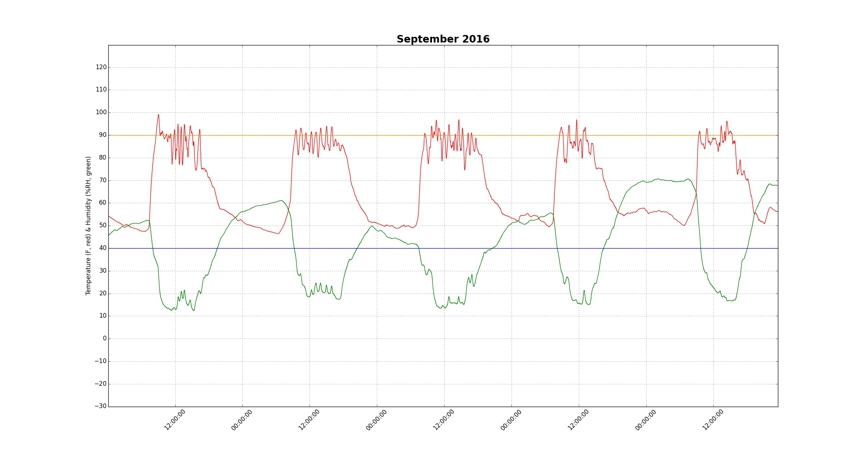
The second chart (below) shows the temperature variations in the greenhouse over a period of five days in September 2016, after the greenhouse environment automation components were installed. The simplest possible control algorithm was used to regulate temperature. If the temperature remained above 90° for 10 minutes, the environment manager would open the vents by 25% and increase exhaust fan ventilation by 25%. If the temperature remained below 80° for 10 minutes, the environment manager would close the vents by 25% and decrease exhaust fan ventilation by 25%. Even with this simple algorithm and the more severe temperatures of September, the temperatures in the greenhouse never exceeded 100° and varied less than 25°. The oscillatory effect caused by the simple control method can readily be seen in the temperature curves. Under a more sophisticated control method, such as a proportional-integral or proportional-integral-derivative algorithm, it should be possible to achieve much better temperature control with virtually no oscillation.
|
|
This page last revised on 05/05/2018 |